TLDR;
Give both a go. If you already use Telescope, I would recommend Telescope Toolbar to prevent overhead. Otherwise I still prefer Laravel Debugbar, but if you feel it’s too heavy, give Telescope Toolbar a try!
Let me know if you have any improvements for Telescope Toolbar or (Laravel) Debugbar!
A little history
When we started using Laravel at Fruitcake, it was around the time of Laravel 3. It didn’t have Composer support yet and was a bit limited, but did contain things like Eloquent and Blade templates. One of the things it also contained was a small toolbar called ‘Anbu’, created by Dayle Rees.
When Laravel 4 came around the corner, it was pretty great with Composer support etc. But there were 2 main issues we had with it:
- PhpStorm didn’t understand Facades
- No more (Anbu) development toolbar
For the first one, I created laravel-ide-helper and for the second one, I came accross PHP Debugbar.
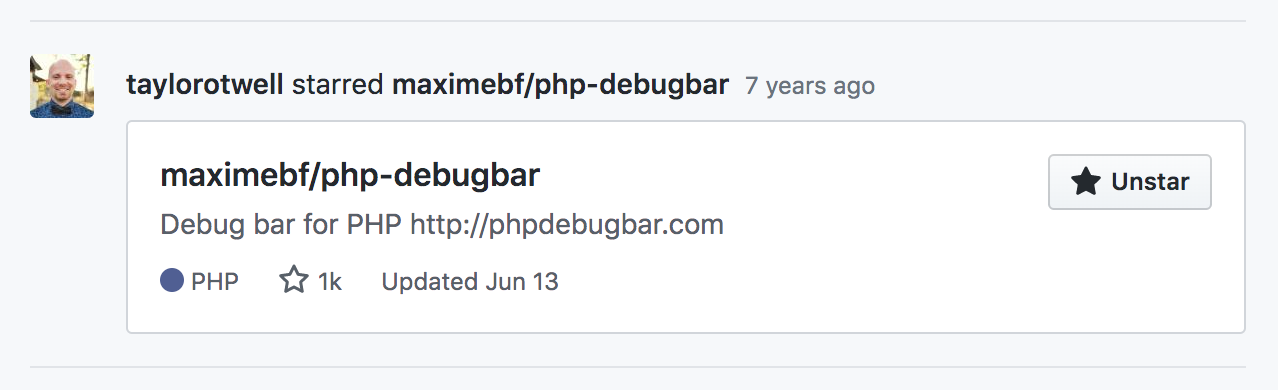
After toying around with it, I quickly got a proof-of-concept working. And just before the official Laravel 4.0 release at the end of 2013, Laravel Debugbar was released, already providing most of the features you use today:
During the last 7 years the layout changed to make it Laravel specific, new collectors have been added and functionality has improved (also upstream to debugbar).
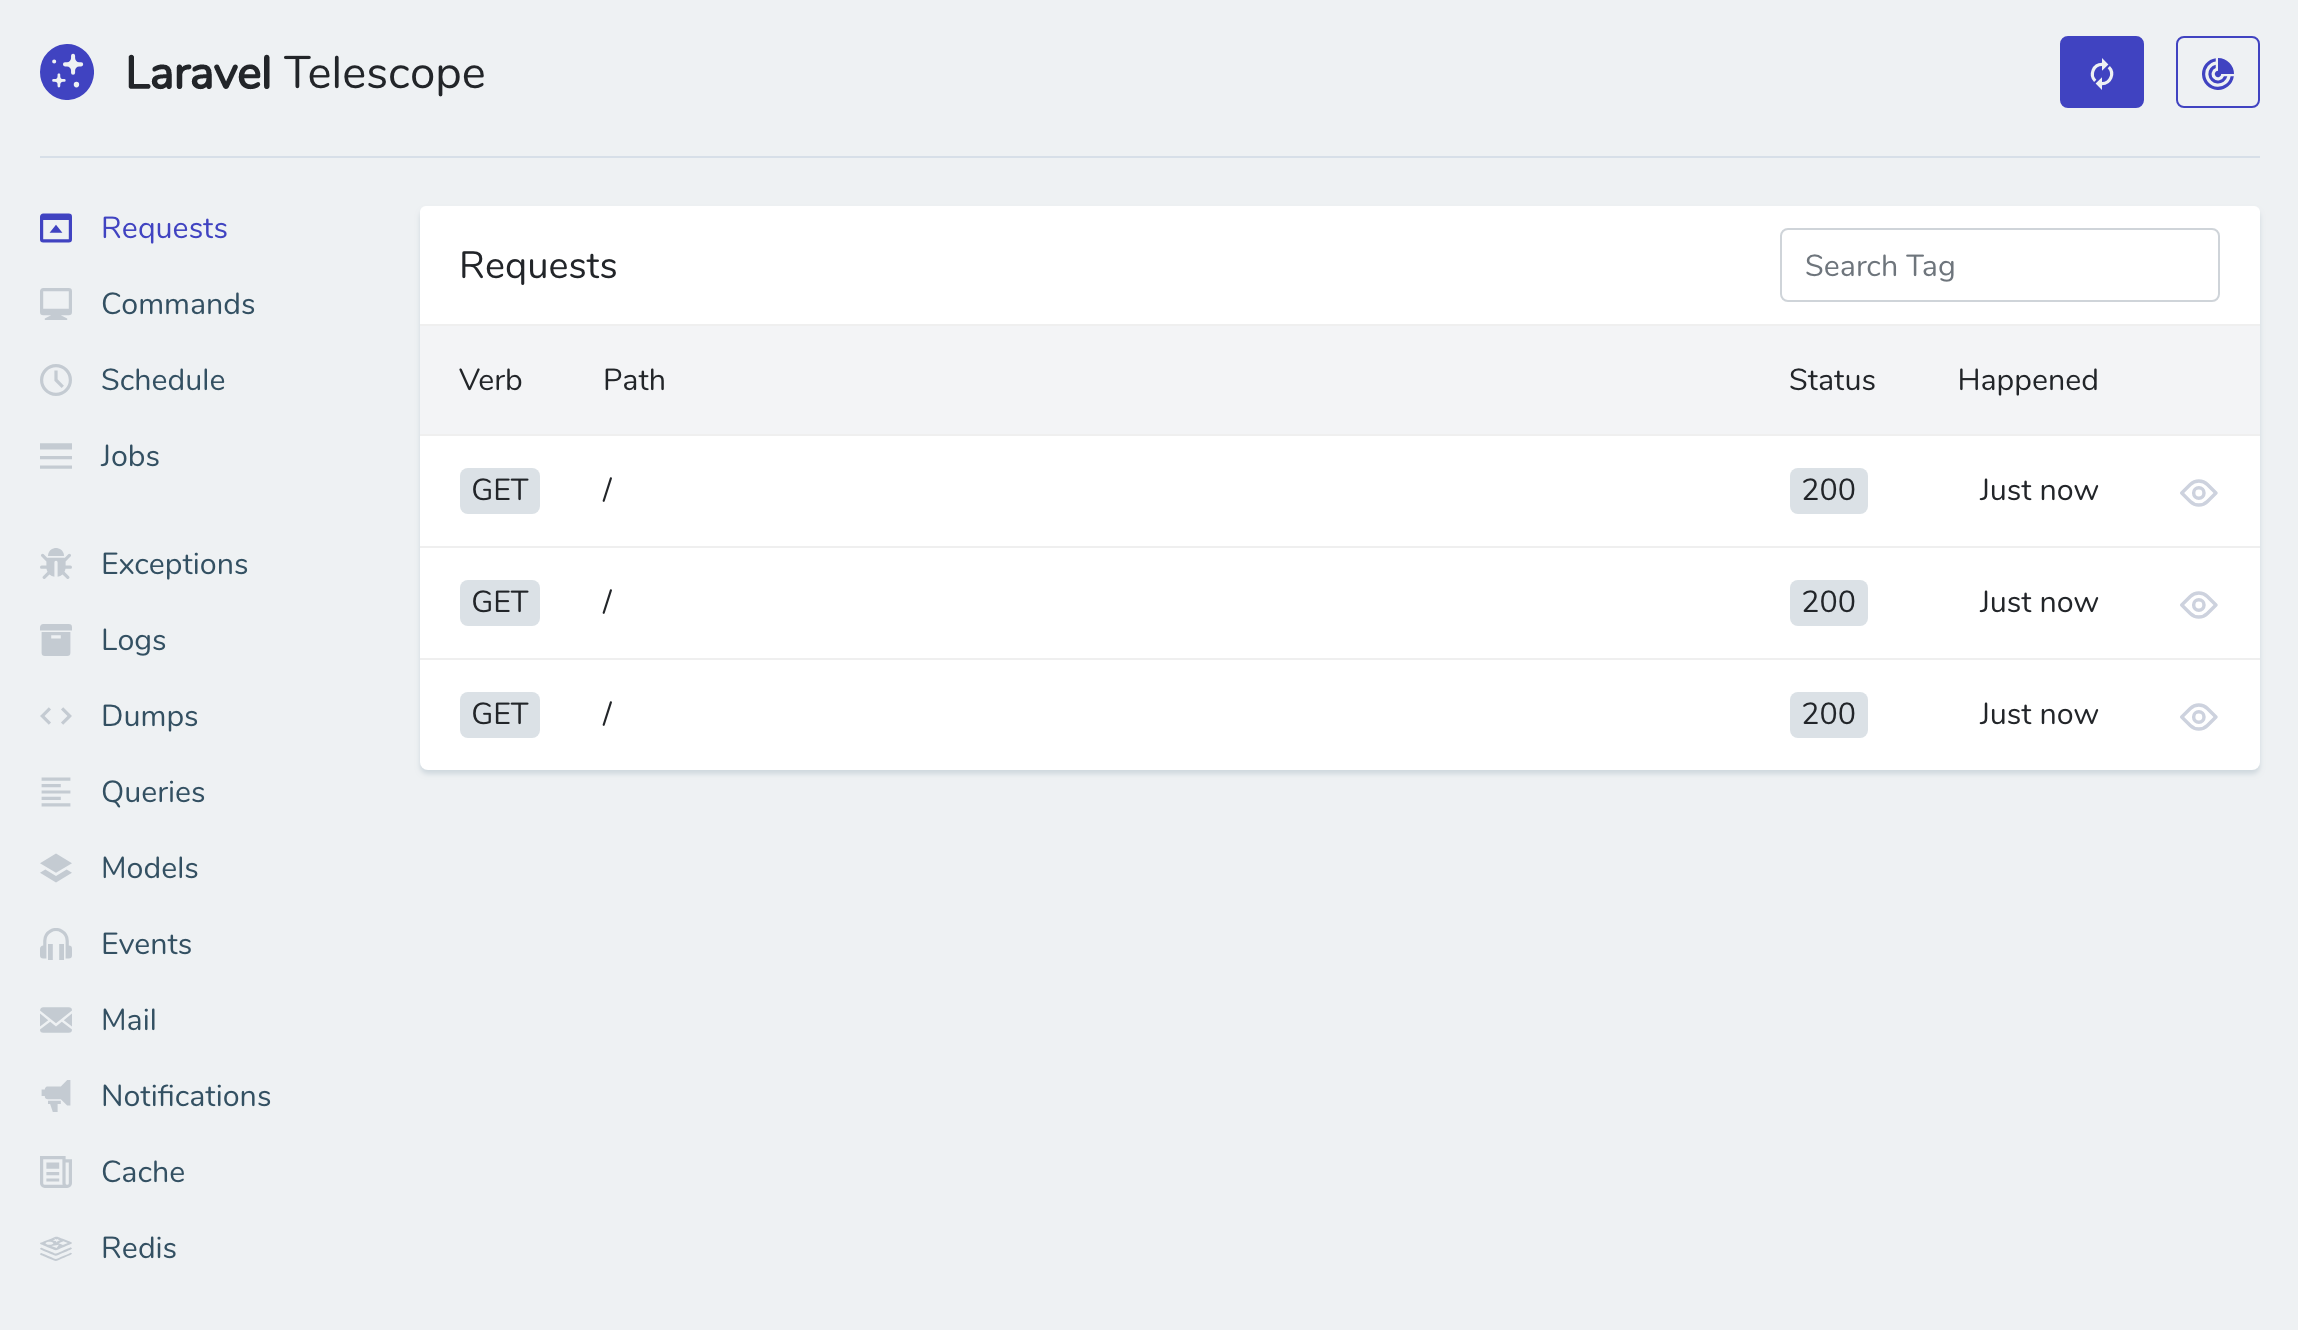
5 years after (November 2018), Laravel released Laravel Telescope, giving Laravel developers a first-party tool. Not a direct replacement for Debugbar, but it does have similar functionality.
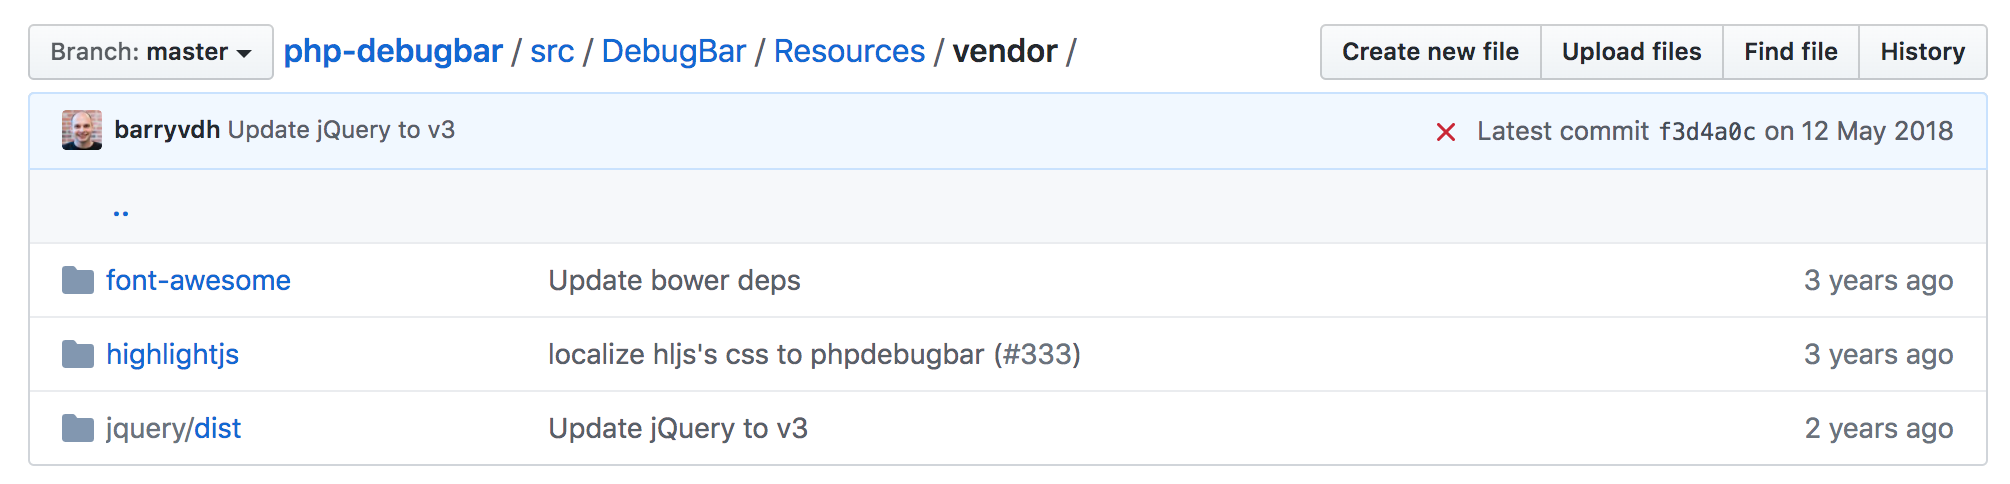
During the last 7 years, the core of Debugbar didn’t change and was still using a lot of jQuery. I looked into the Symfony toolbar as modern alternative a few times, but it didn’t warrant such a big rewrite. When Telescope launched, I liked the general approach with Storage etc and Symfony Toolbar was now decoupled enough to use stand-alone. Thus Laravel Telescope Toolbar was born.
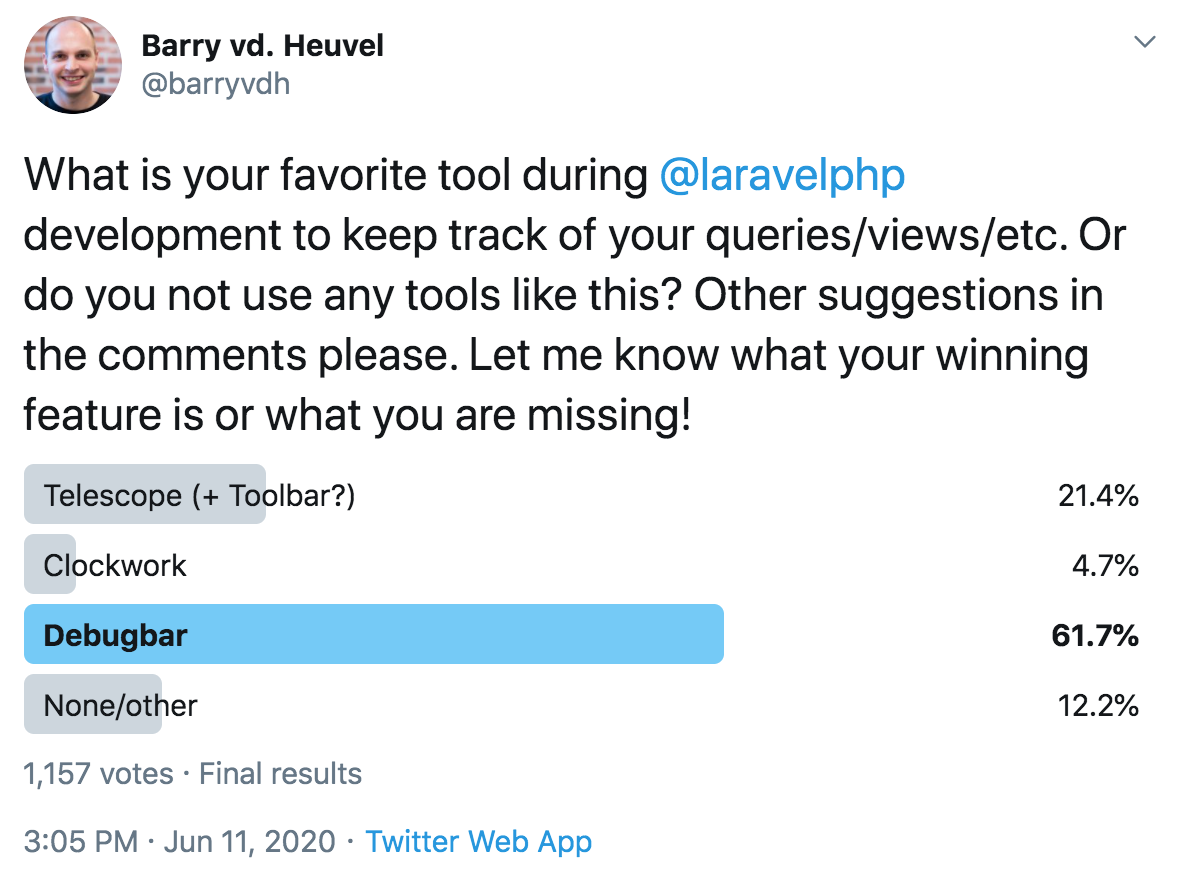
I recently did a poll to see how many of my followers use Telescope or Laravel Debugbar, and the majority at this moment still uses Debugbar (which is great!)
Technological differences
Laravel Debugbar uses Collectors to gather data during the request cycle. At the end of the request, all data is collected, formatted and stored (usually in the storage dir, but DB can be used). For normal requests, the data is then flashed in the session and rendered on the next requests. For ajax requests the ID is passed in the headers and loaded through an EventListener on XHR requests. All gathered data is loaded and formatted directly by the Debugbar, which can cause delays for large datasets (eg. 1000+ queries). This usually isn’t a big problem, but more of an indicator that you should optimize ;) 3rd party libraries are used (Font Awesome, Highlight.js, jQuery), but these are scoped to avoid interference.
Telescope Toolbar only displays data that is already gathered by Telescope. The data is always loaded async, after the page has loaded, for both normal and ajax requests. No external dependancies are used to prevent library collisions, just plain Javascript and SVG icons. The Toolbar content is rendered by PHP (Blade templates), so it doesn’t freeze your browser when displaying a lot of data (that much), and it’s easier to show just the summary and redirect to Telescope for the rest.
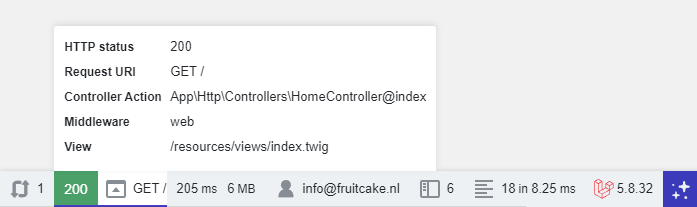
In short; Debugbar is both the toolbar and the detailed info, Telescope Toolbar is just the toolbar and leverages Telescope for the rest. Telescope Toolbar is less browser-heavy, but doesn’t show all information in the toolbar itself.
Features
Both toolbars provide the same basic functionality:
- Debug queries
- Show current route/controller
- Request data
- Views, Mail, Gates, Cache, Auth etc.
But I’ll highlight a few differences.
Debugging Queries
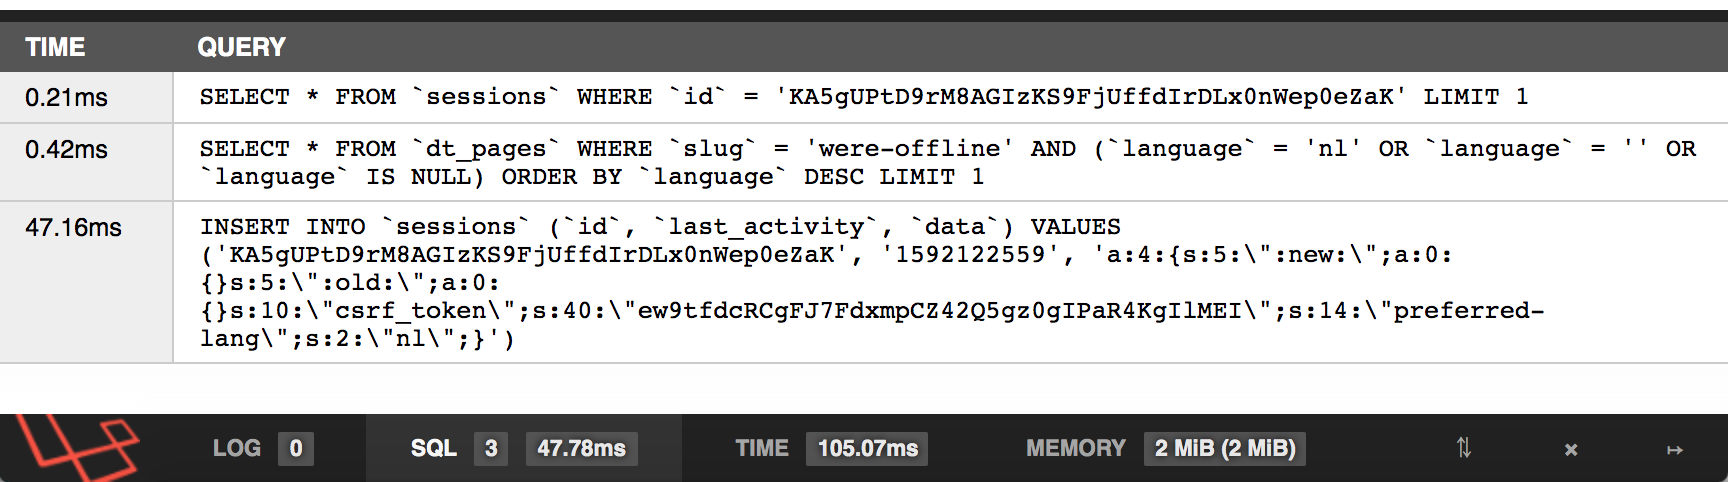
Both Debugbar and Telescope Toolbar show the query (with replaced bindings), duration and caller.
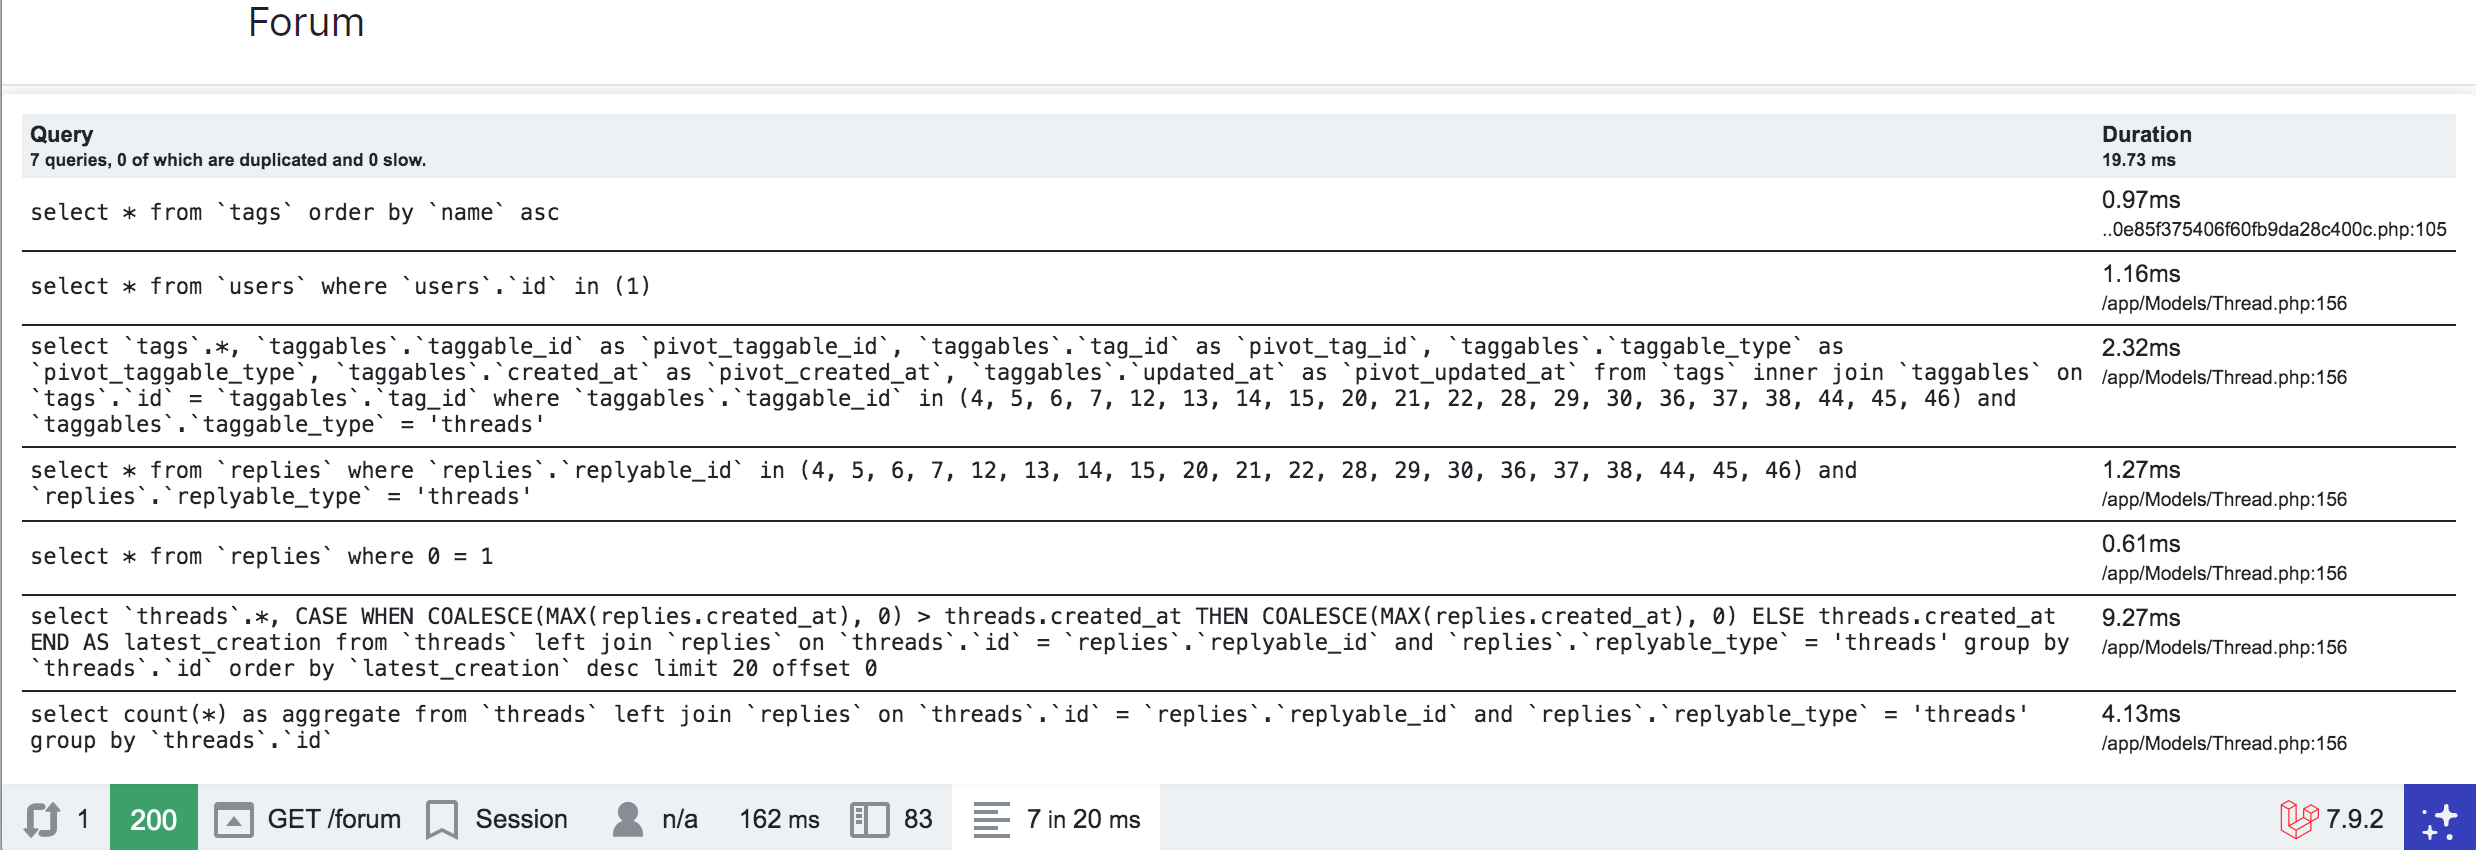
Debugbar also uses syntax highlighting to format the query.
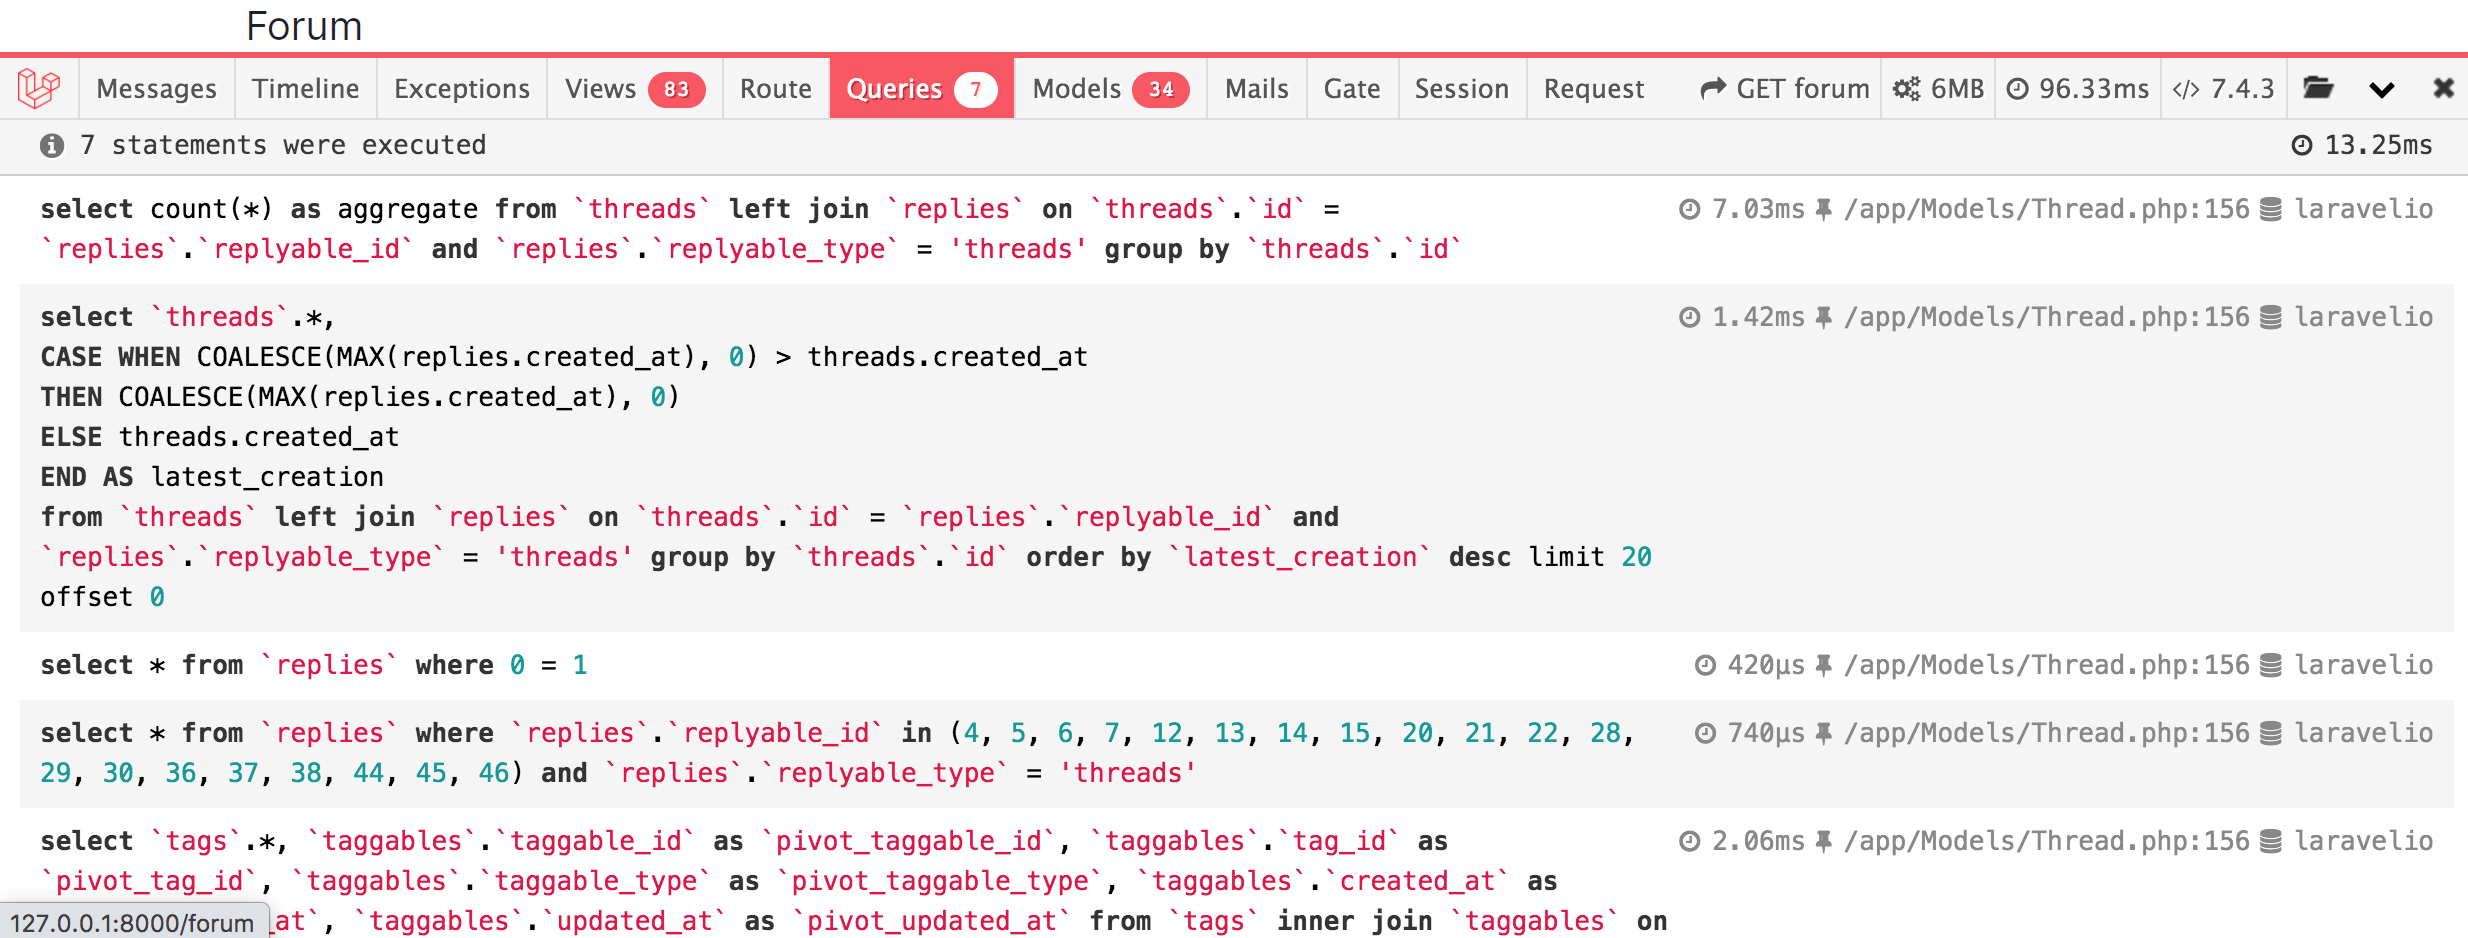
While Debugbar has some extra features (like more backtrace info, or EXPLAIN calls), the most common case is covered for bot.
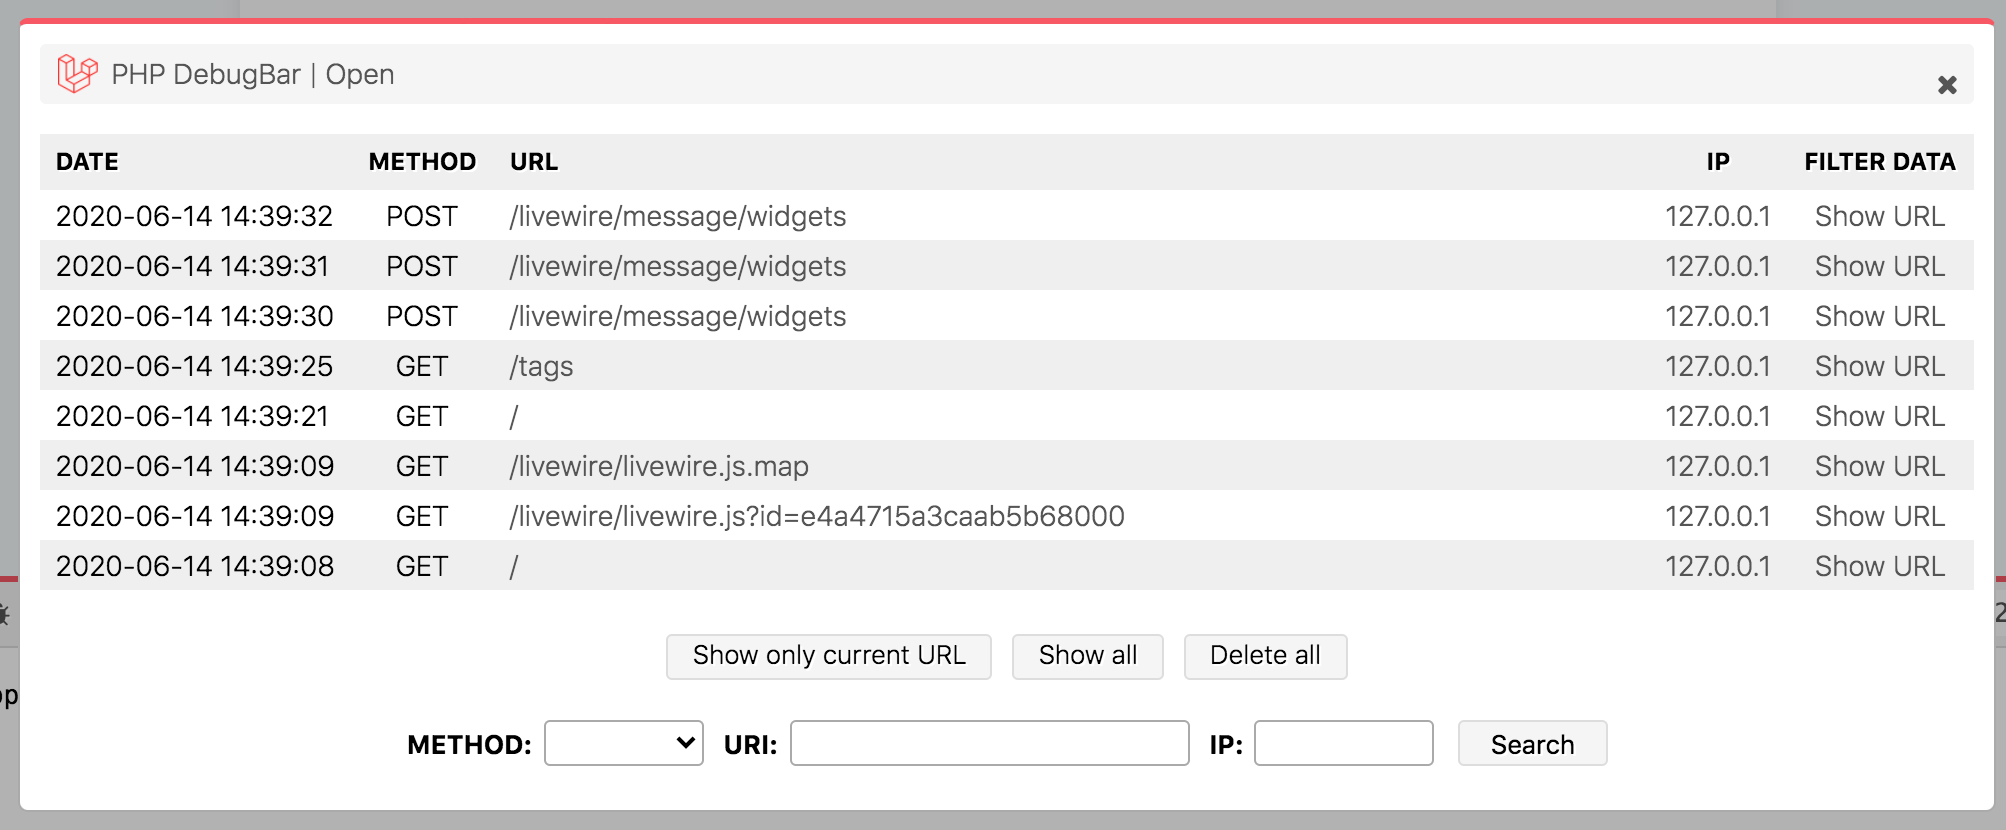
Showing Ajax Requests
Both toolbar will catch and load Ajax requests automatically. With Toolbar this can be toggled off.
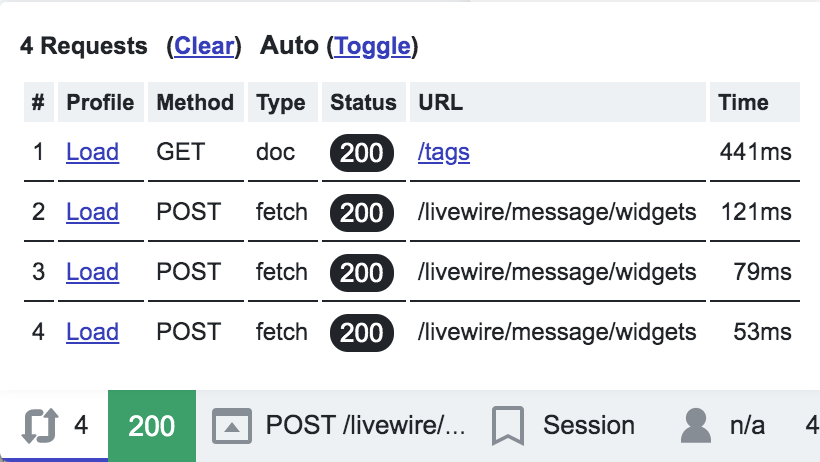
Telescope Toolbar even shows the running requests + details while Debugbar only adds the entry to the list (and switches data).
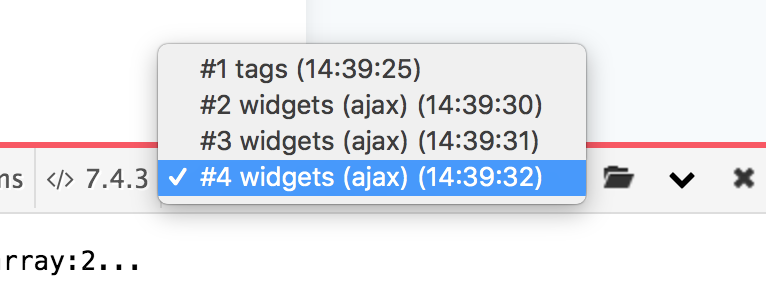
Debugbar also offers a Browse function, but for Telescope Toolbar you can just look in Telescope itself.
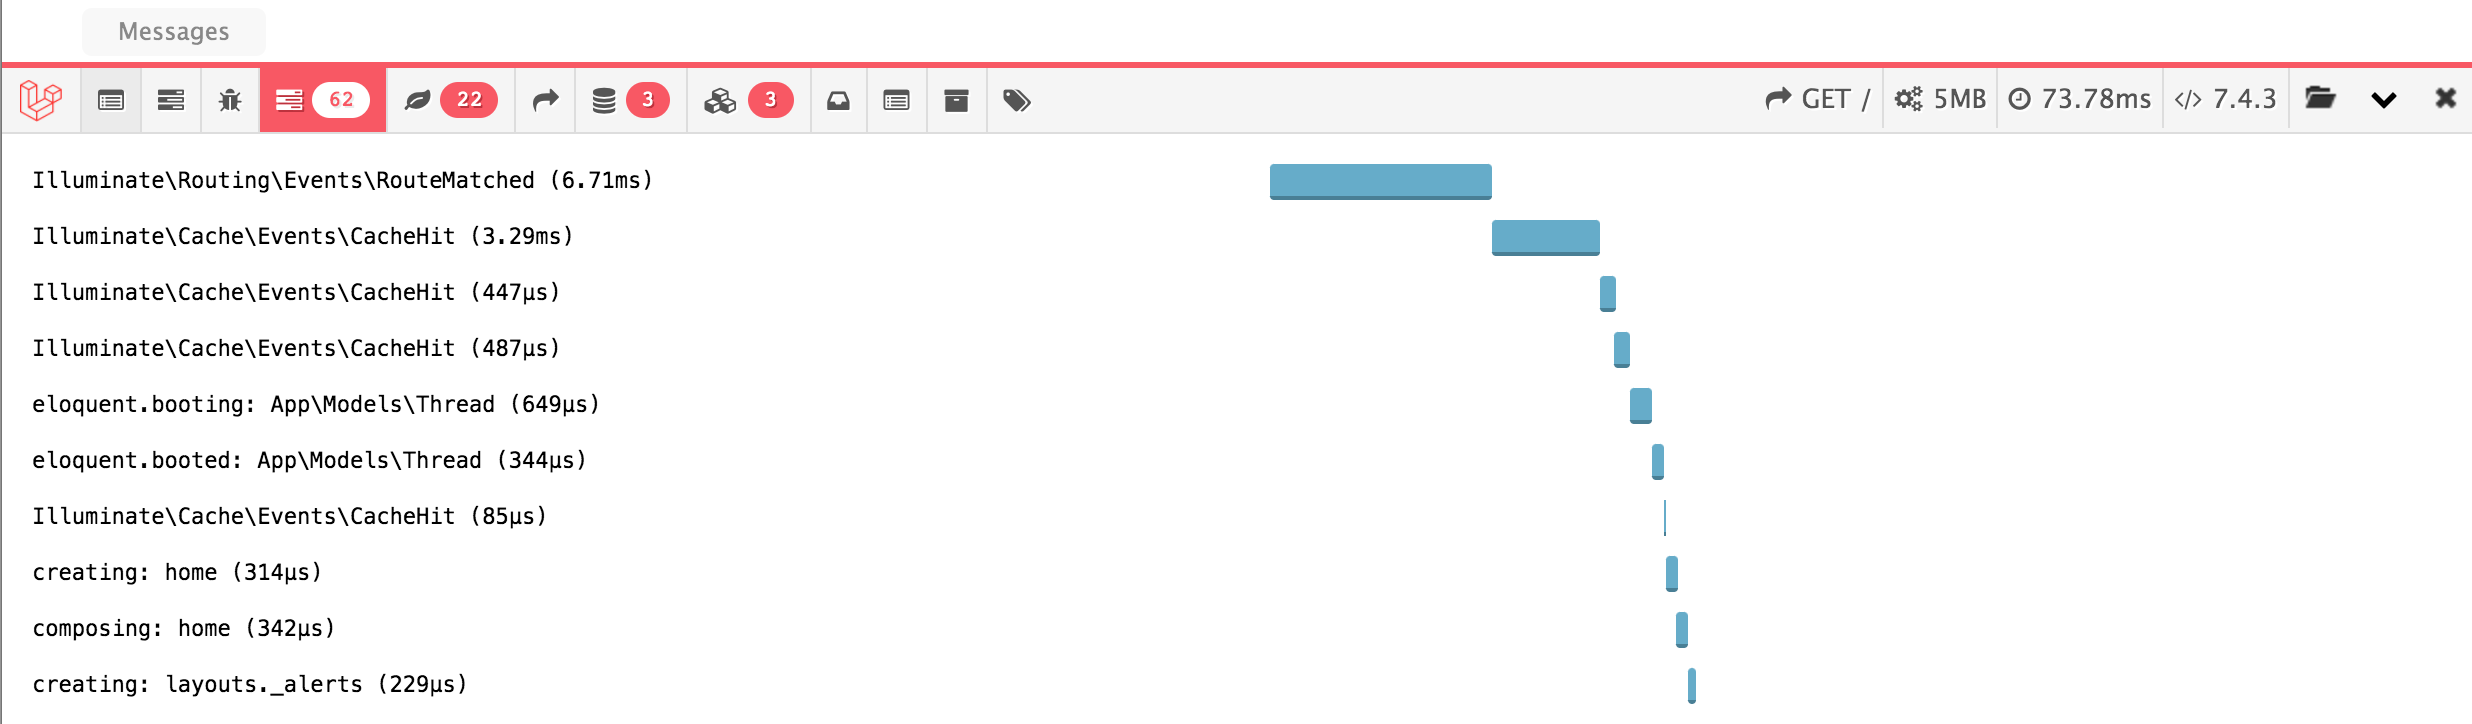
Timeline
Telescope does not offer a Timeline (yet), but with Laravel Debugbar you have a Timeline by default where you can add your own measurements. You can also render Queries or Events in the timeline, to see where a lot of processing time happens.
Dumping data
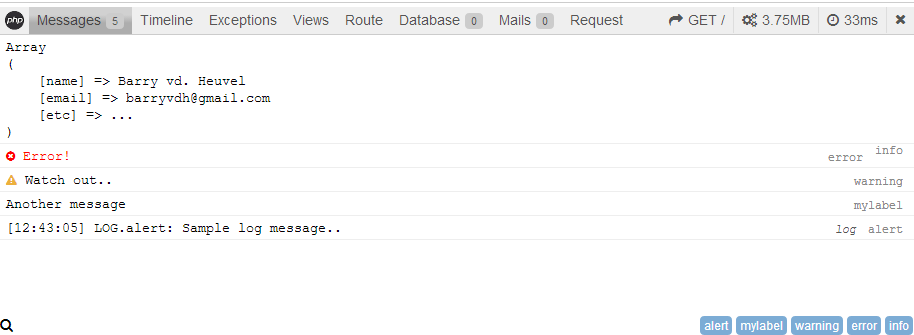
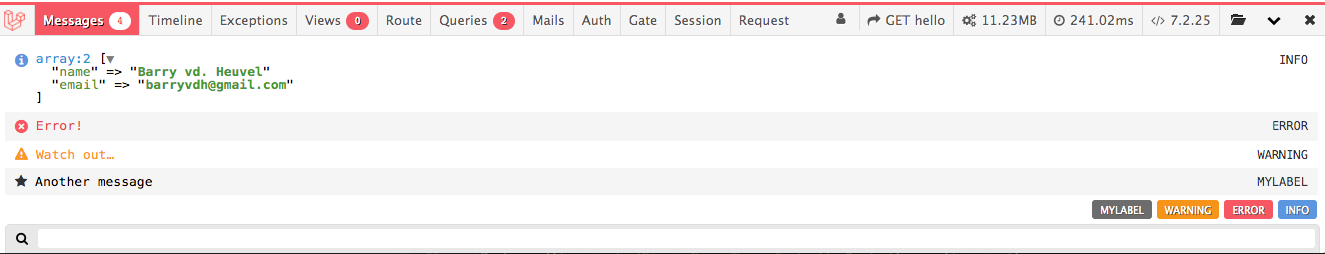
Some people prefer dd() Driven Development, but this breaks the request. I prefer debug() Driven Development.
Both toolbars have a debug() method that work just like dump() but outputs it in the toolbar instead of die()‘ing.
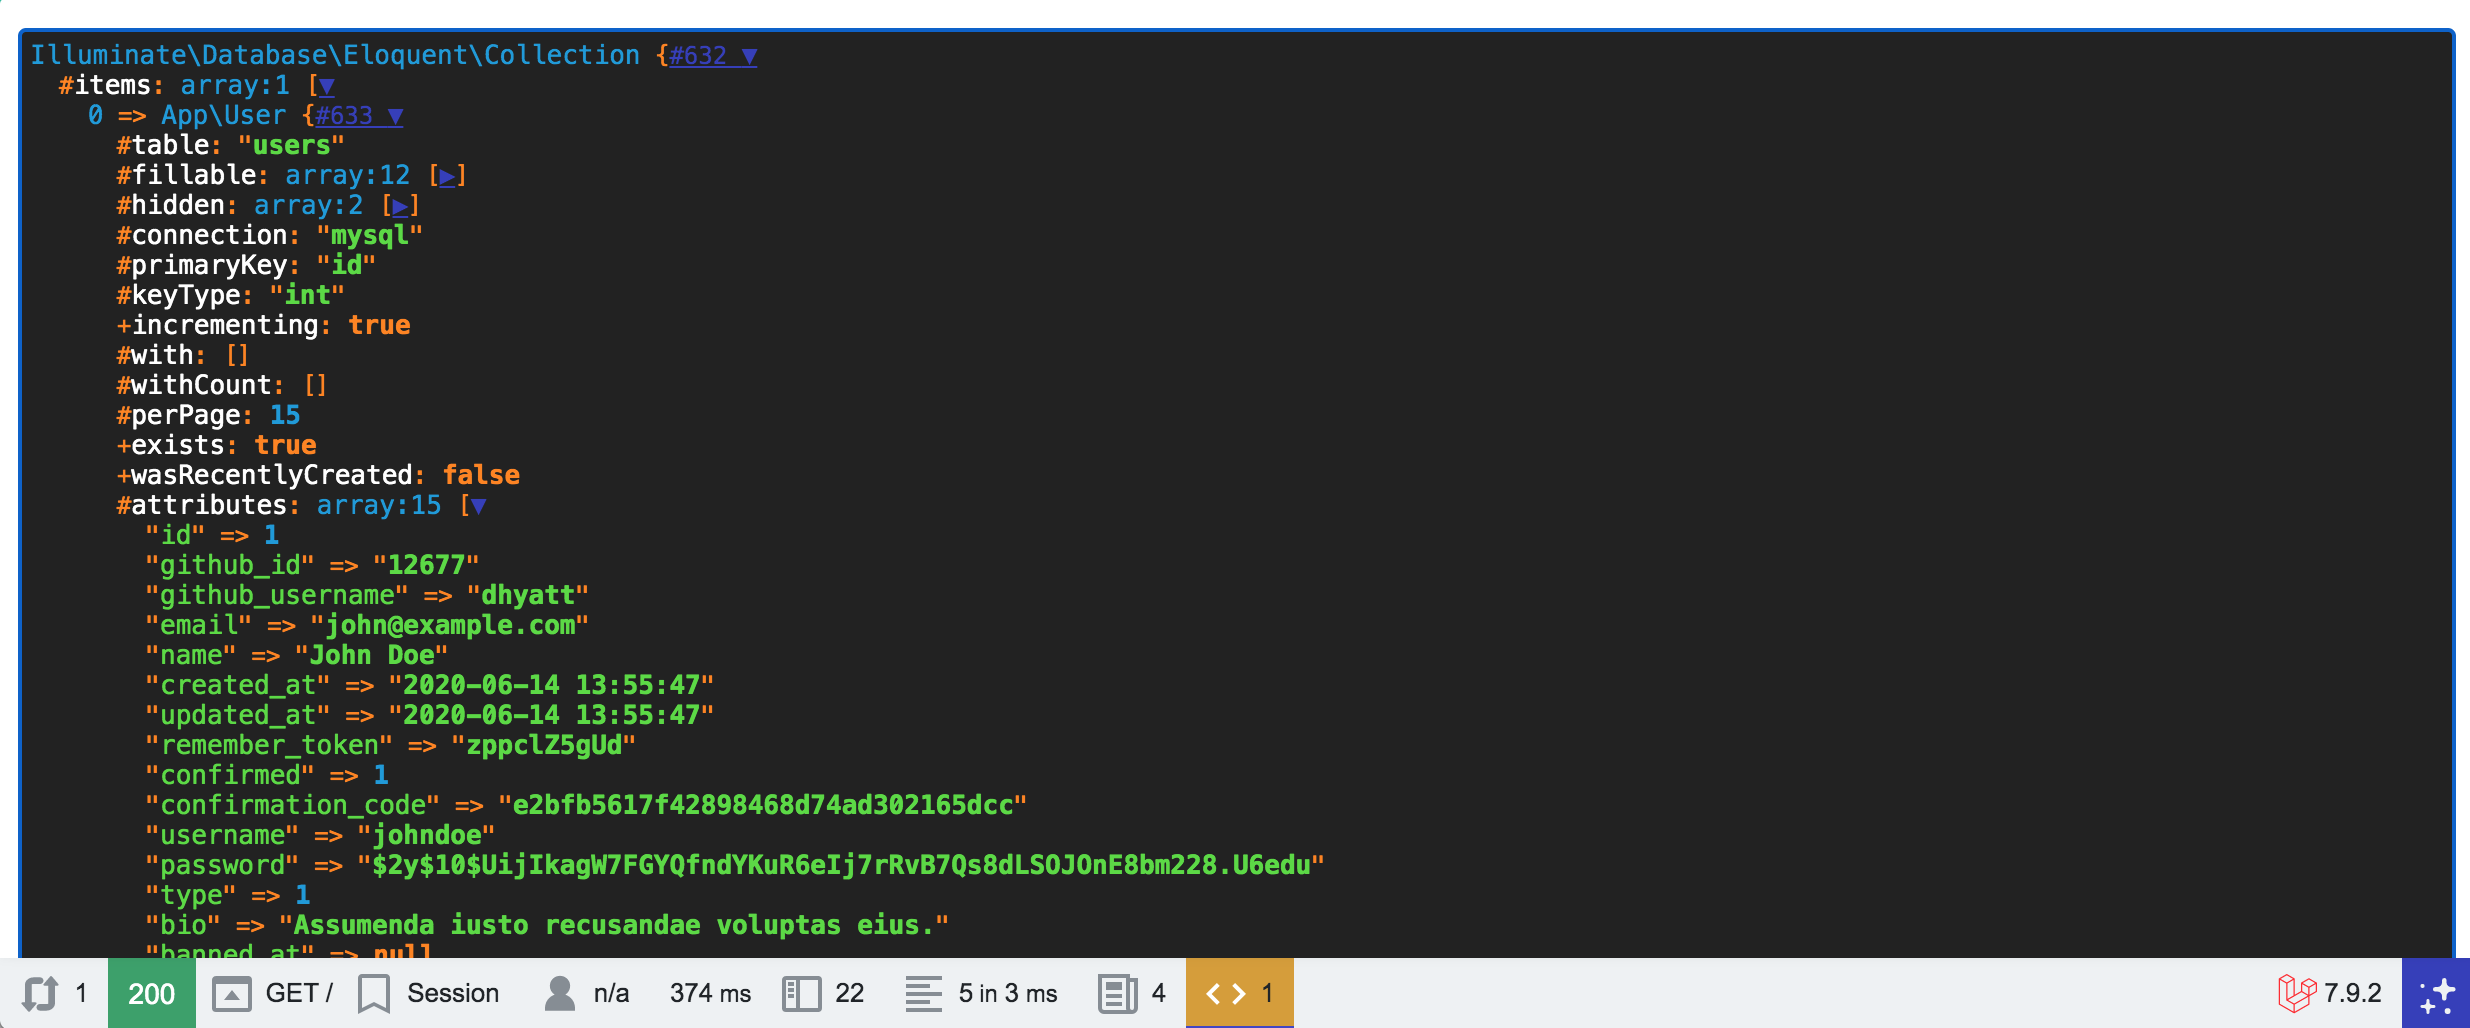
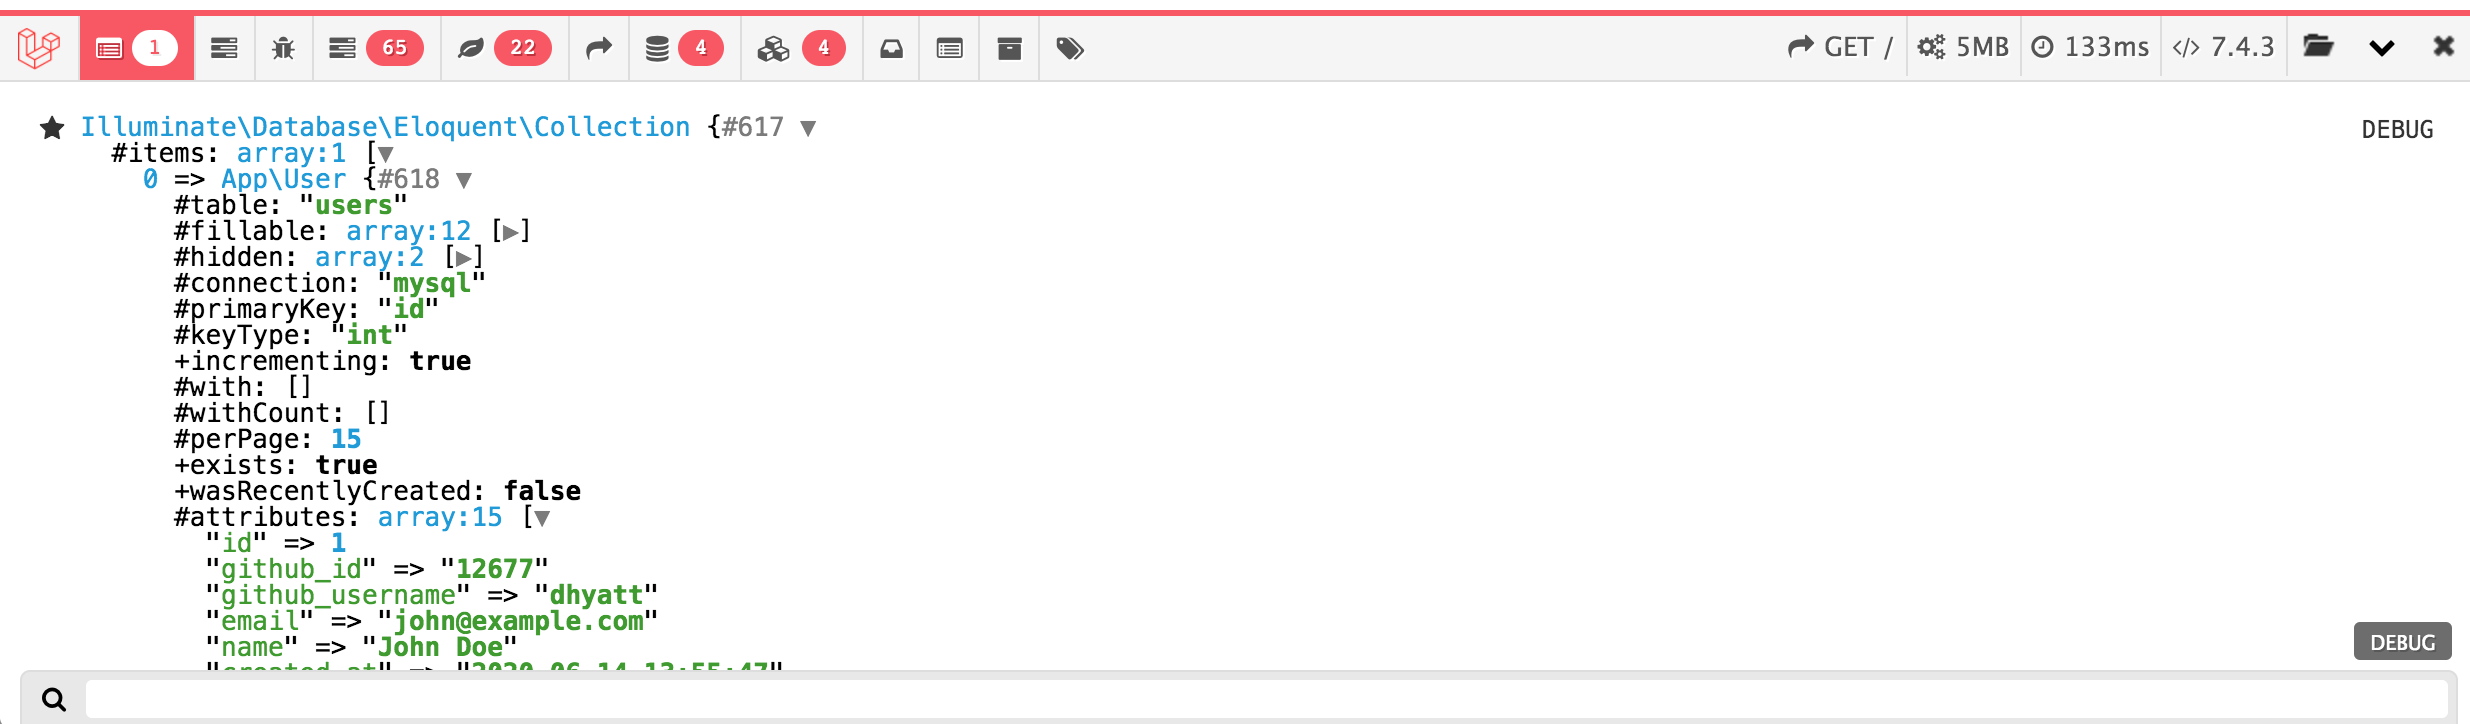
Both use the great Symfony Vardump (like dump() and dd()) to create nice dumps.
Extra features
Telescope Toolbar is limited to what Telescope provides. It’s not really easy to extend Telescope with custom collectors, so your best hope is to create a PR that is accepted.
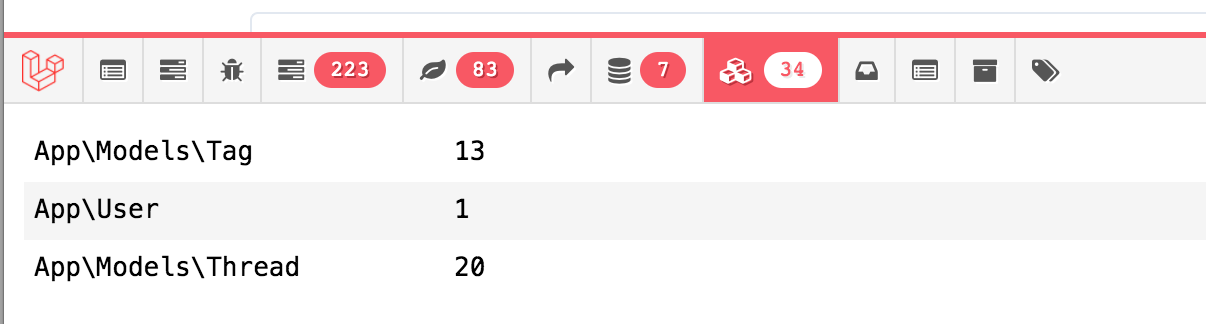
With Debugbar you can add your own collectors, or also submit it as a PR, most recently the Model Count from @reinink
On the other hand, Telescope provides nice features like Exception tracking and Queue/Commands
Alternatives
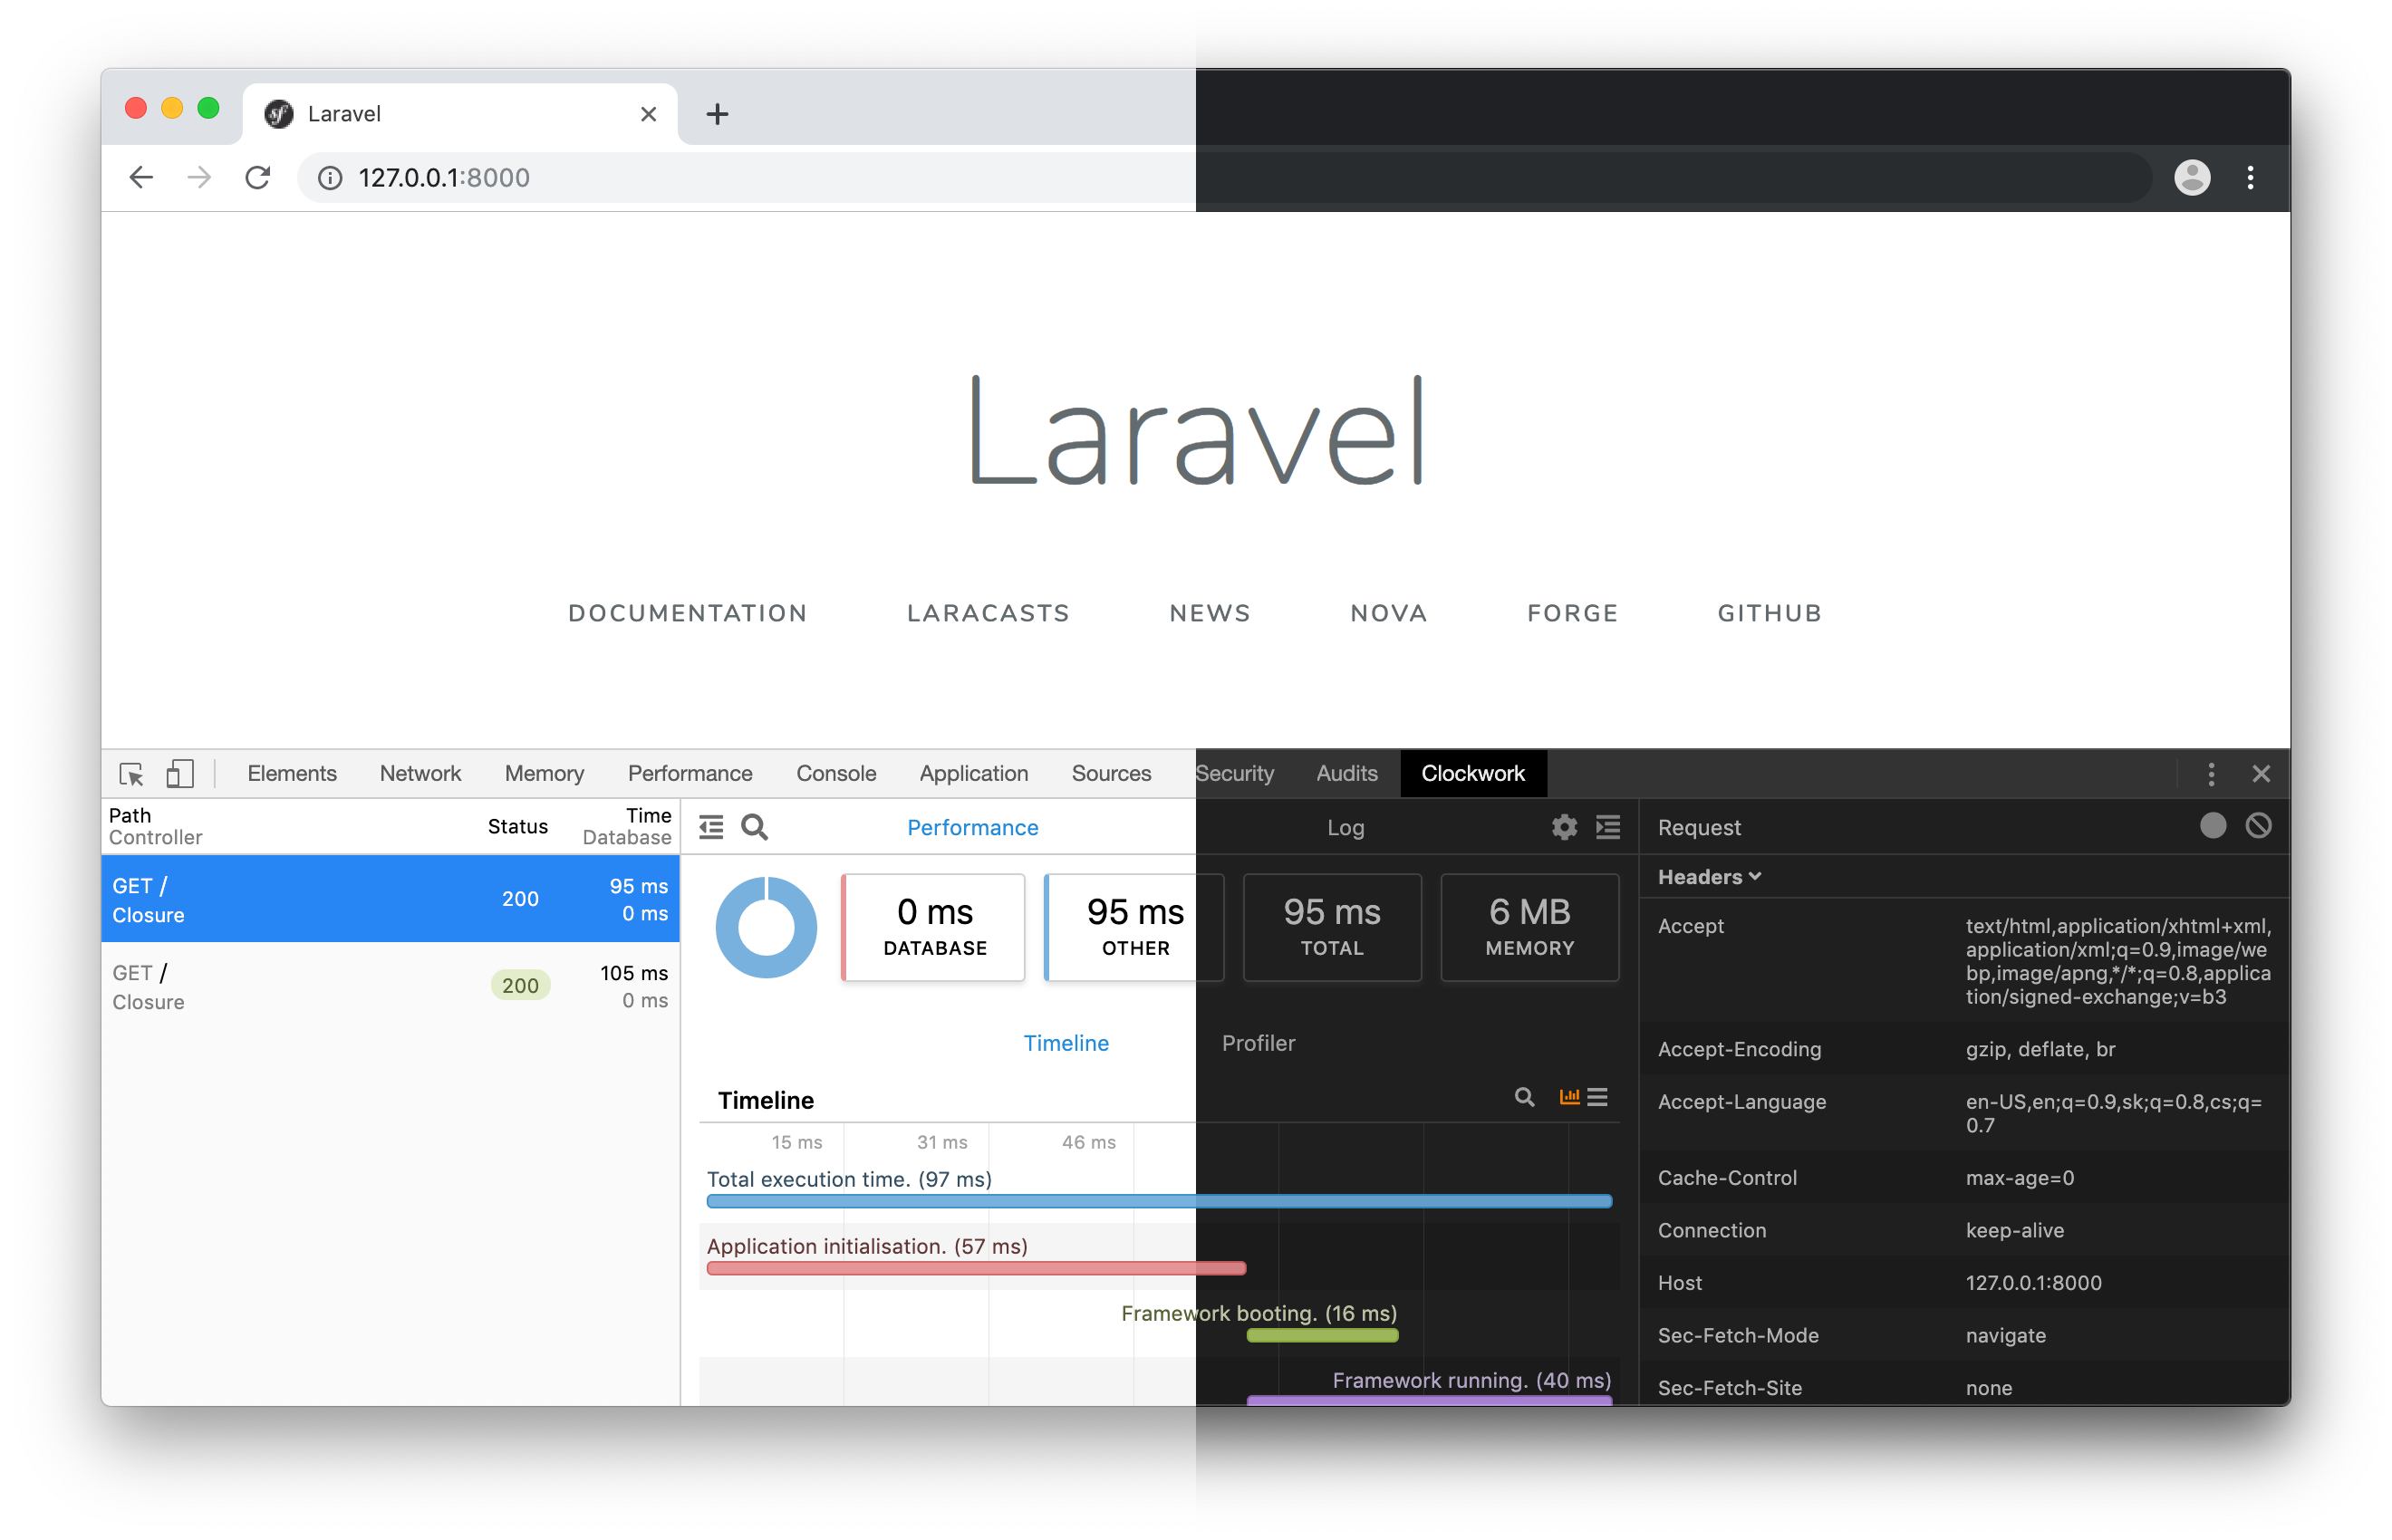
An alternative approach is Clockwork, which doesn’t inject a toolbar directly. All data is rendered by a Chrome Extension. So you might need to install some more, but could prevent some overhead
You can also look into Ray by Spatie which outputs your debug information in a separate window, instead of a toolbar.